Skip to content
Free shipping on 3+ shirts
Original geek tees for coders, science fans & math minds
Designed for those who get the joke

Cart

Your cart is empty

Statistics Shirts

DATA · CHANCE · ERROR Correlation is not causation. We checked twice.
Paranormal Distribution
Paranormal Distribution Sale price$25.00
Normal distribusaurus
Normal distribusaurus Sale price$25.00
Forget Average Be An Outlier
Five Out Of Four People
Five Out Of Four People Sale price$25.00
Type I And Type II
Type I And Type II Sale price$25.00
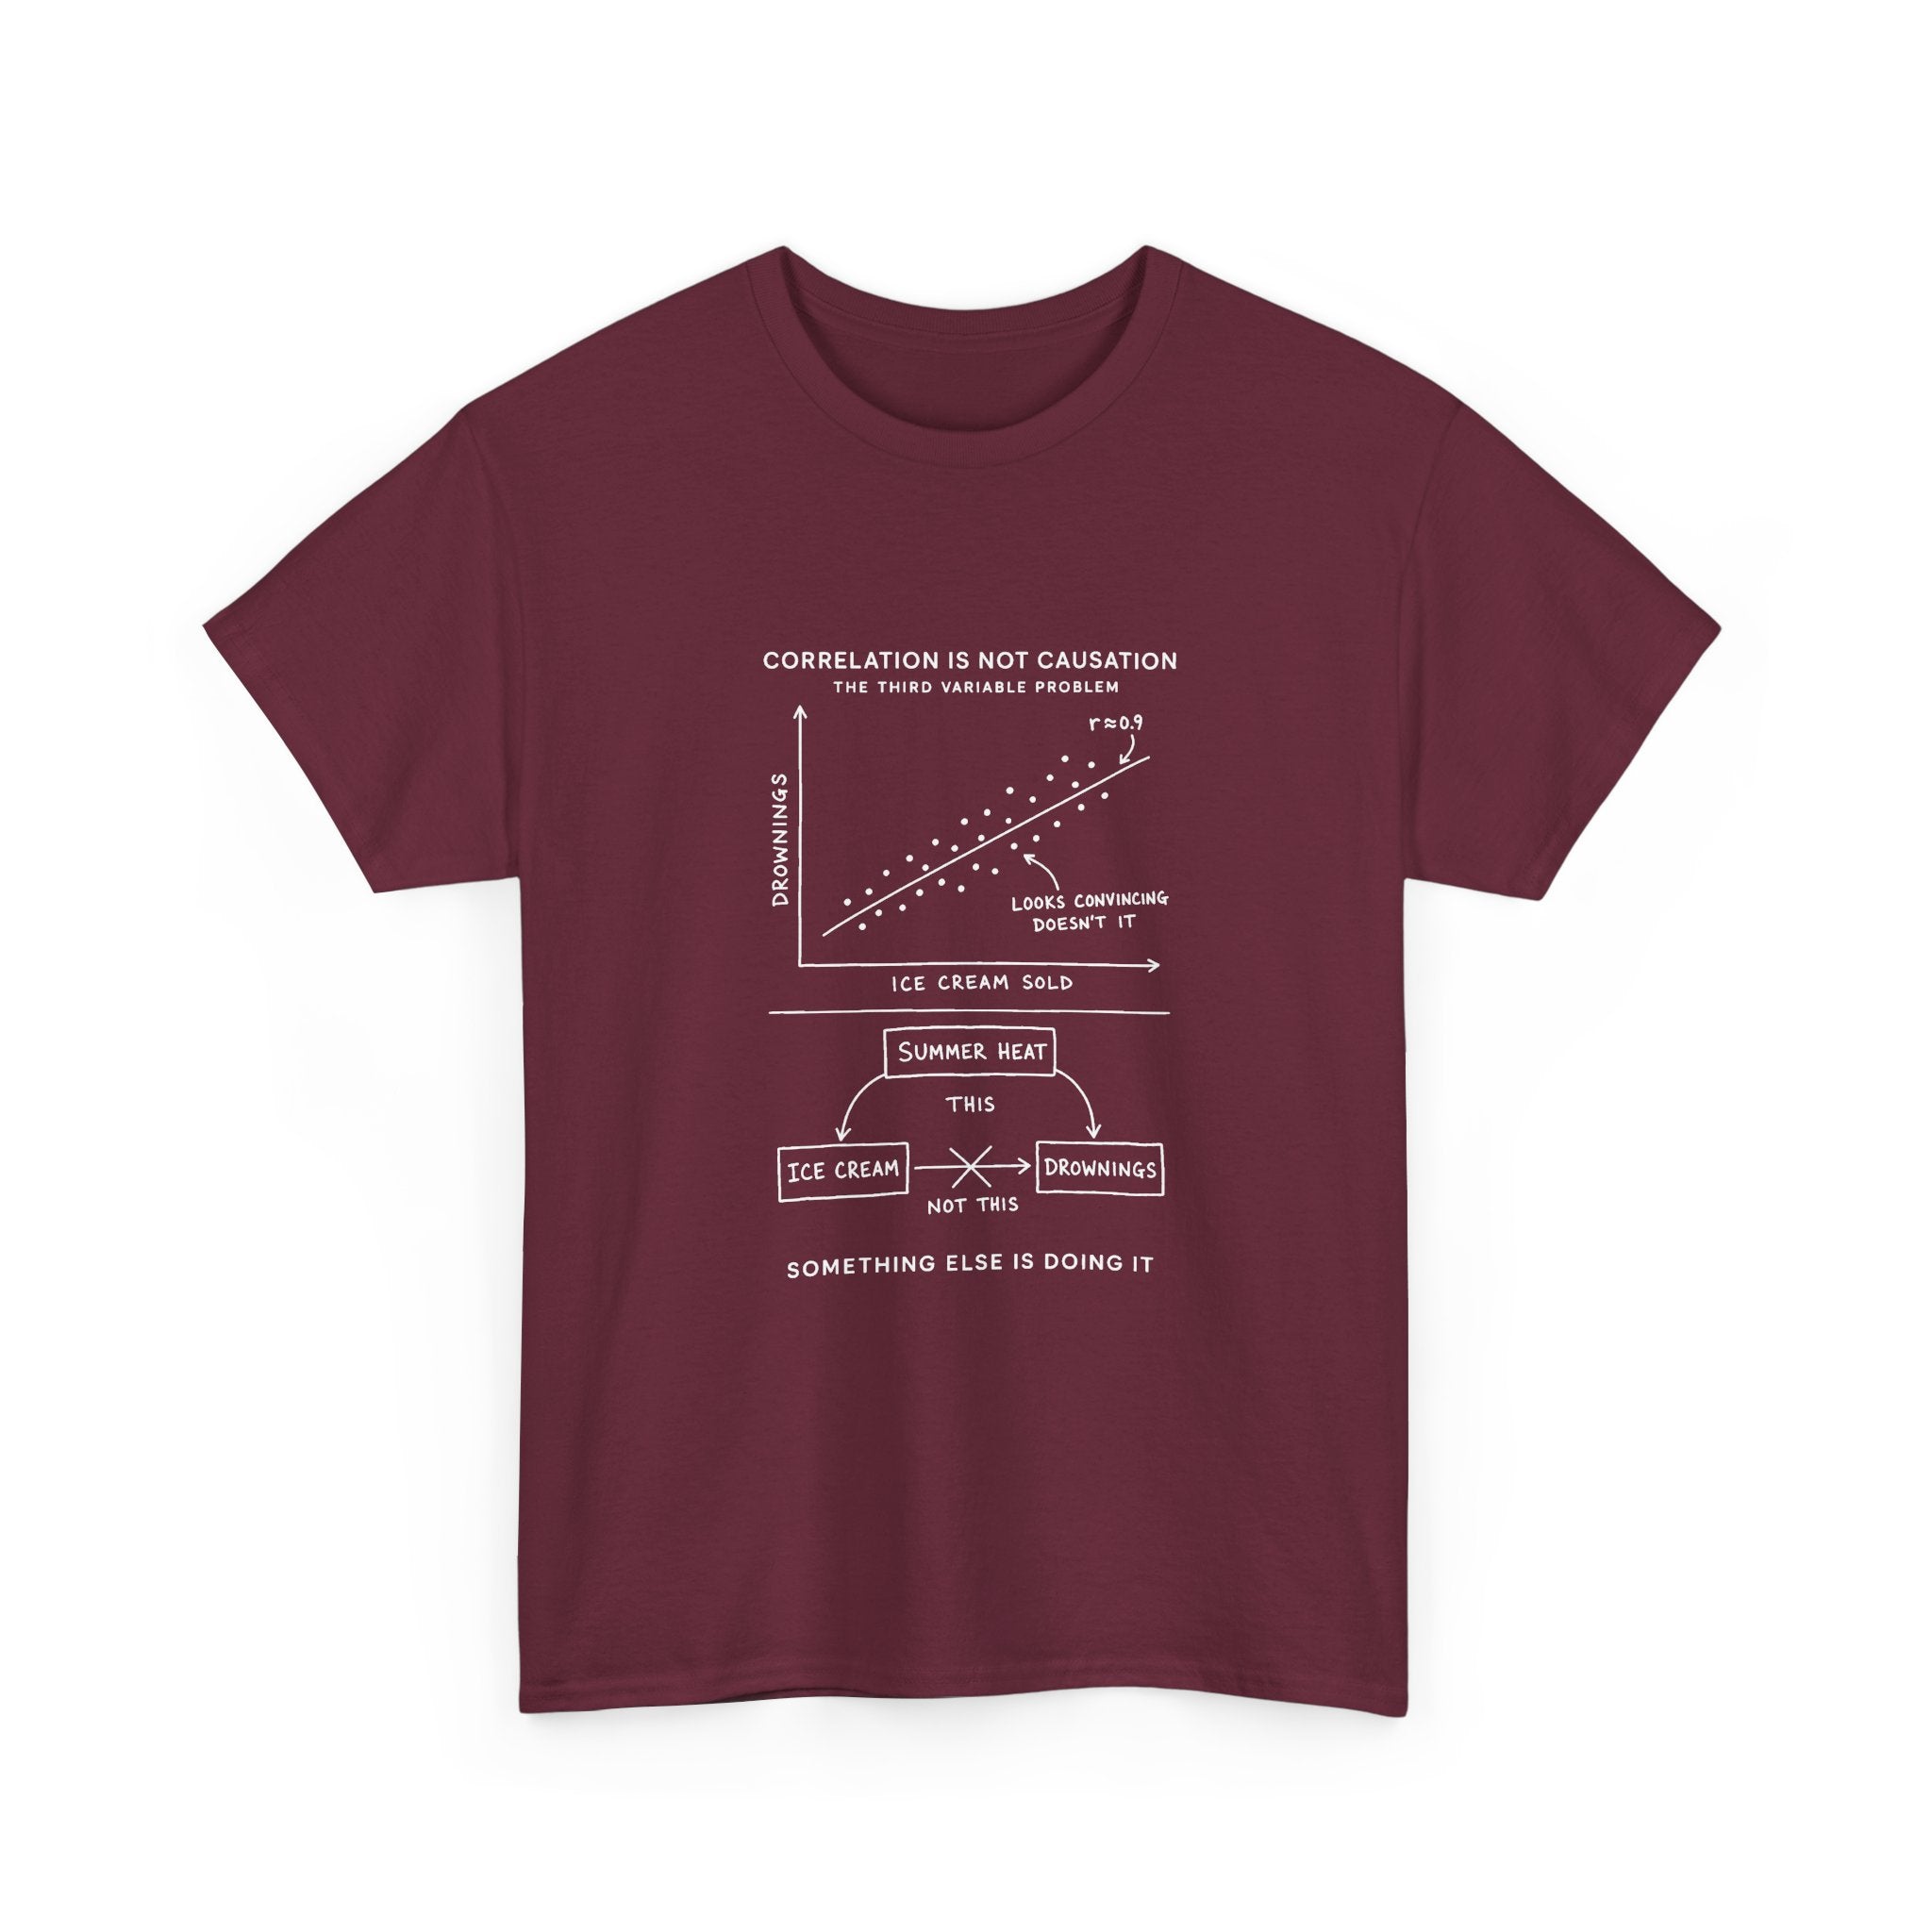
Correlation Is Not Causation
Meanosaur
Meanosaur Sale price$25.00
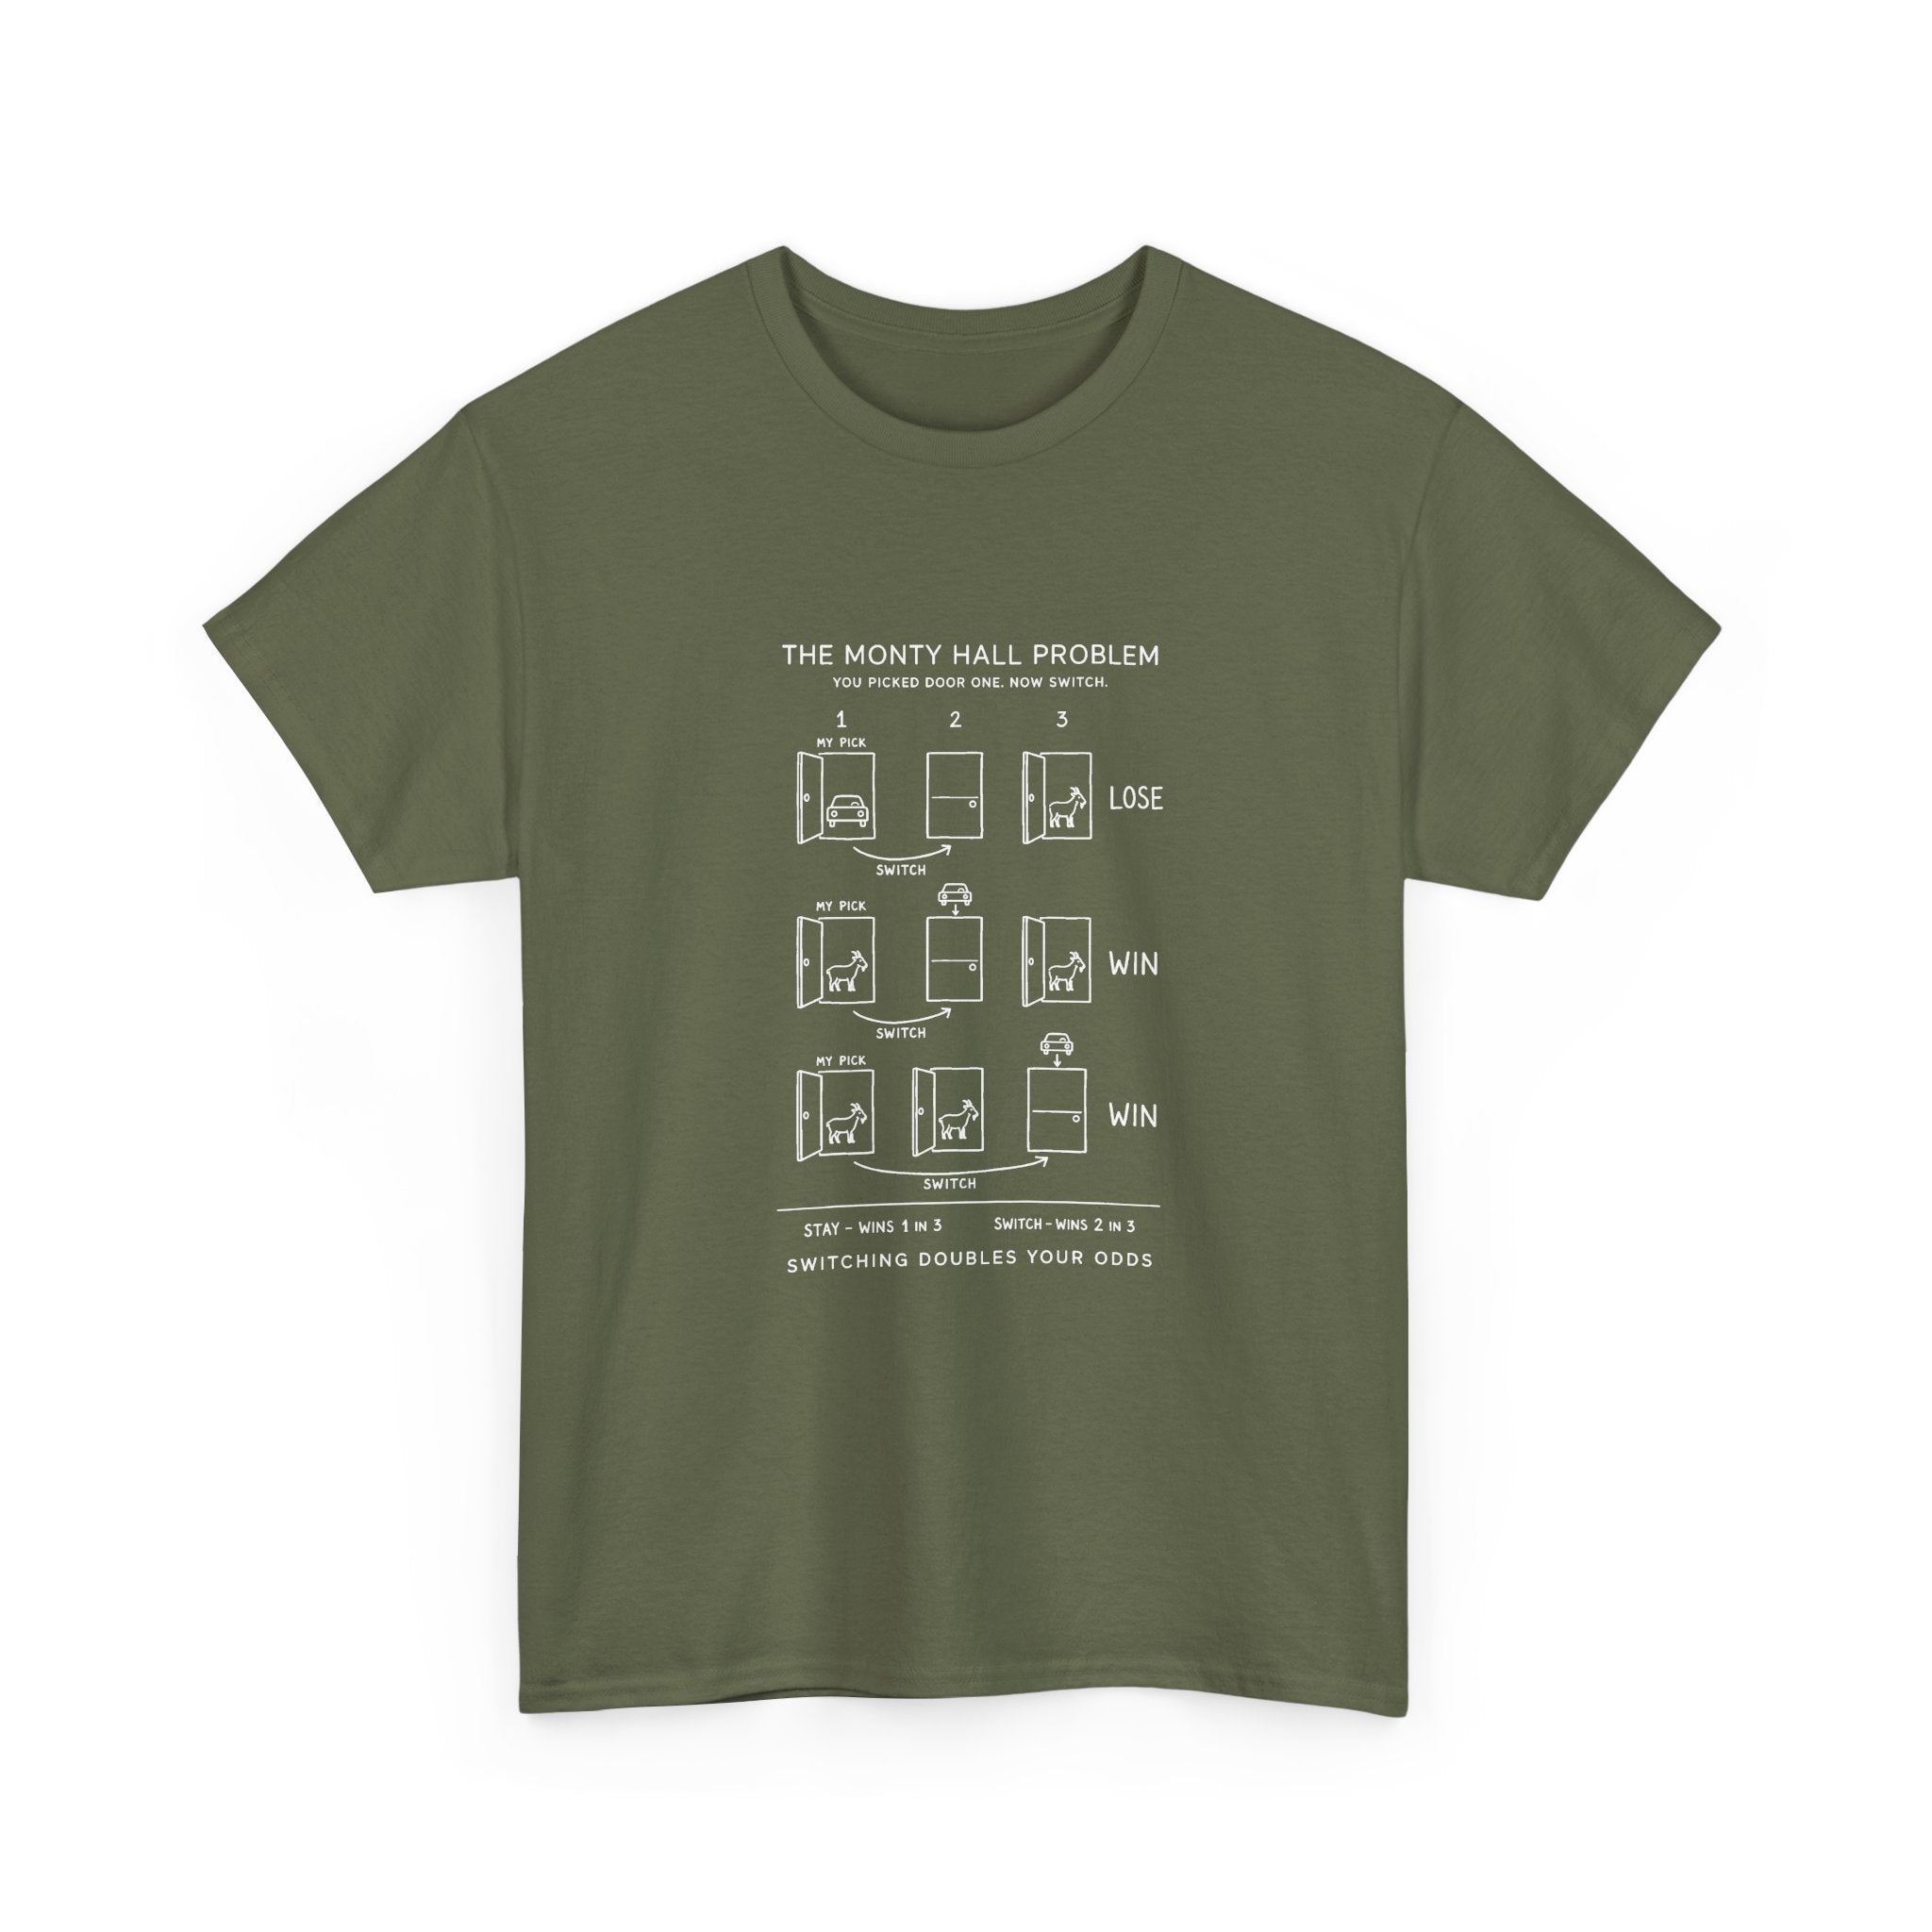
The Three Doors Problem
The Three Doors Problem Sale price$25.00
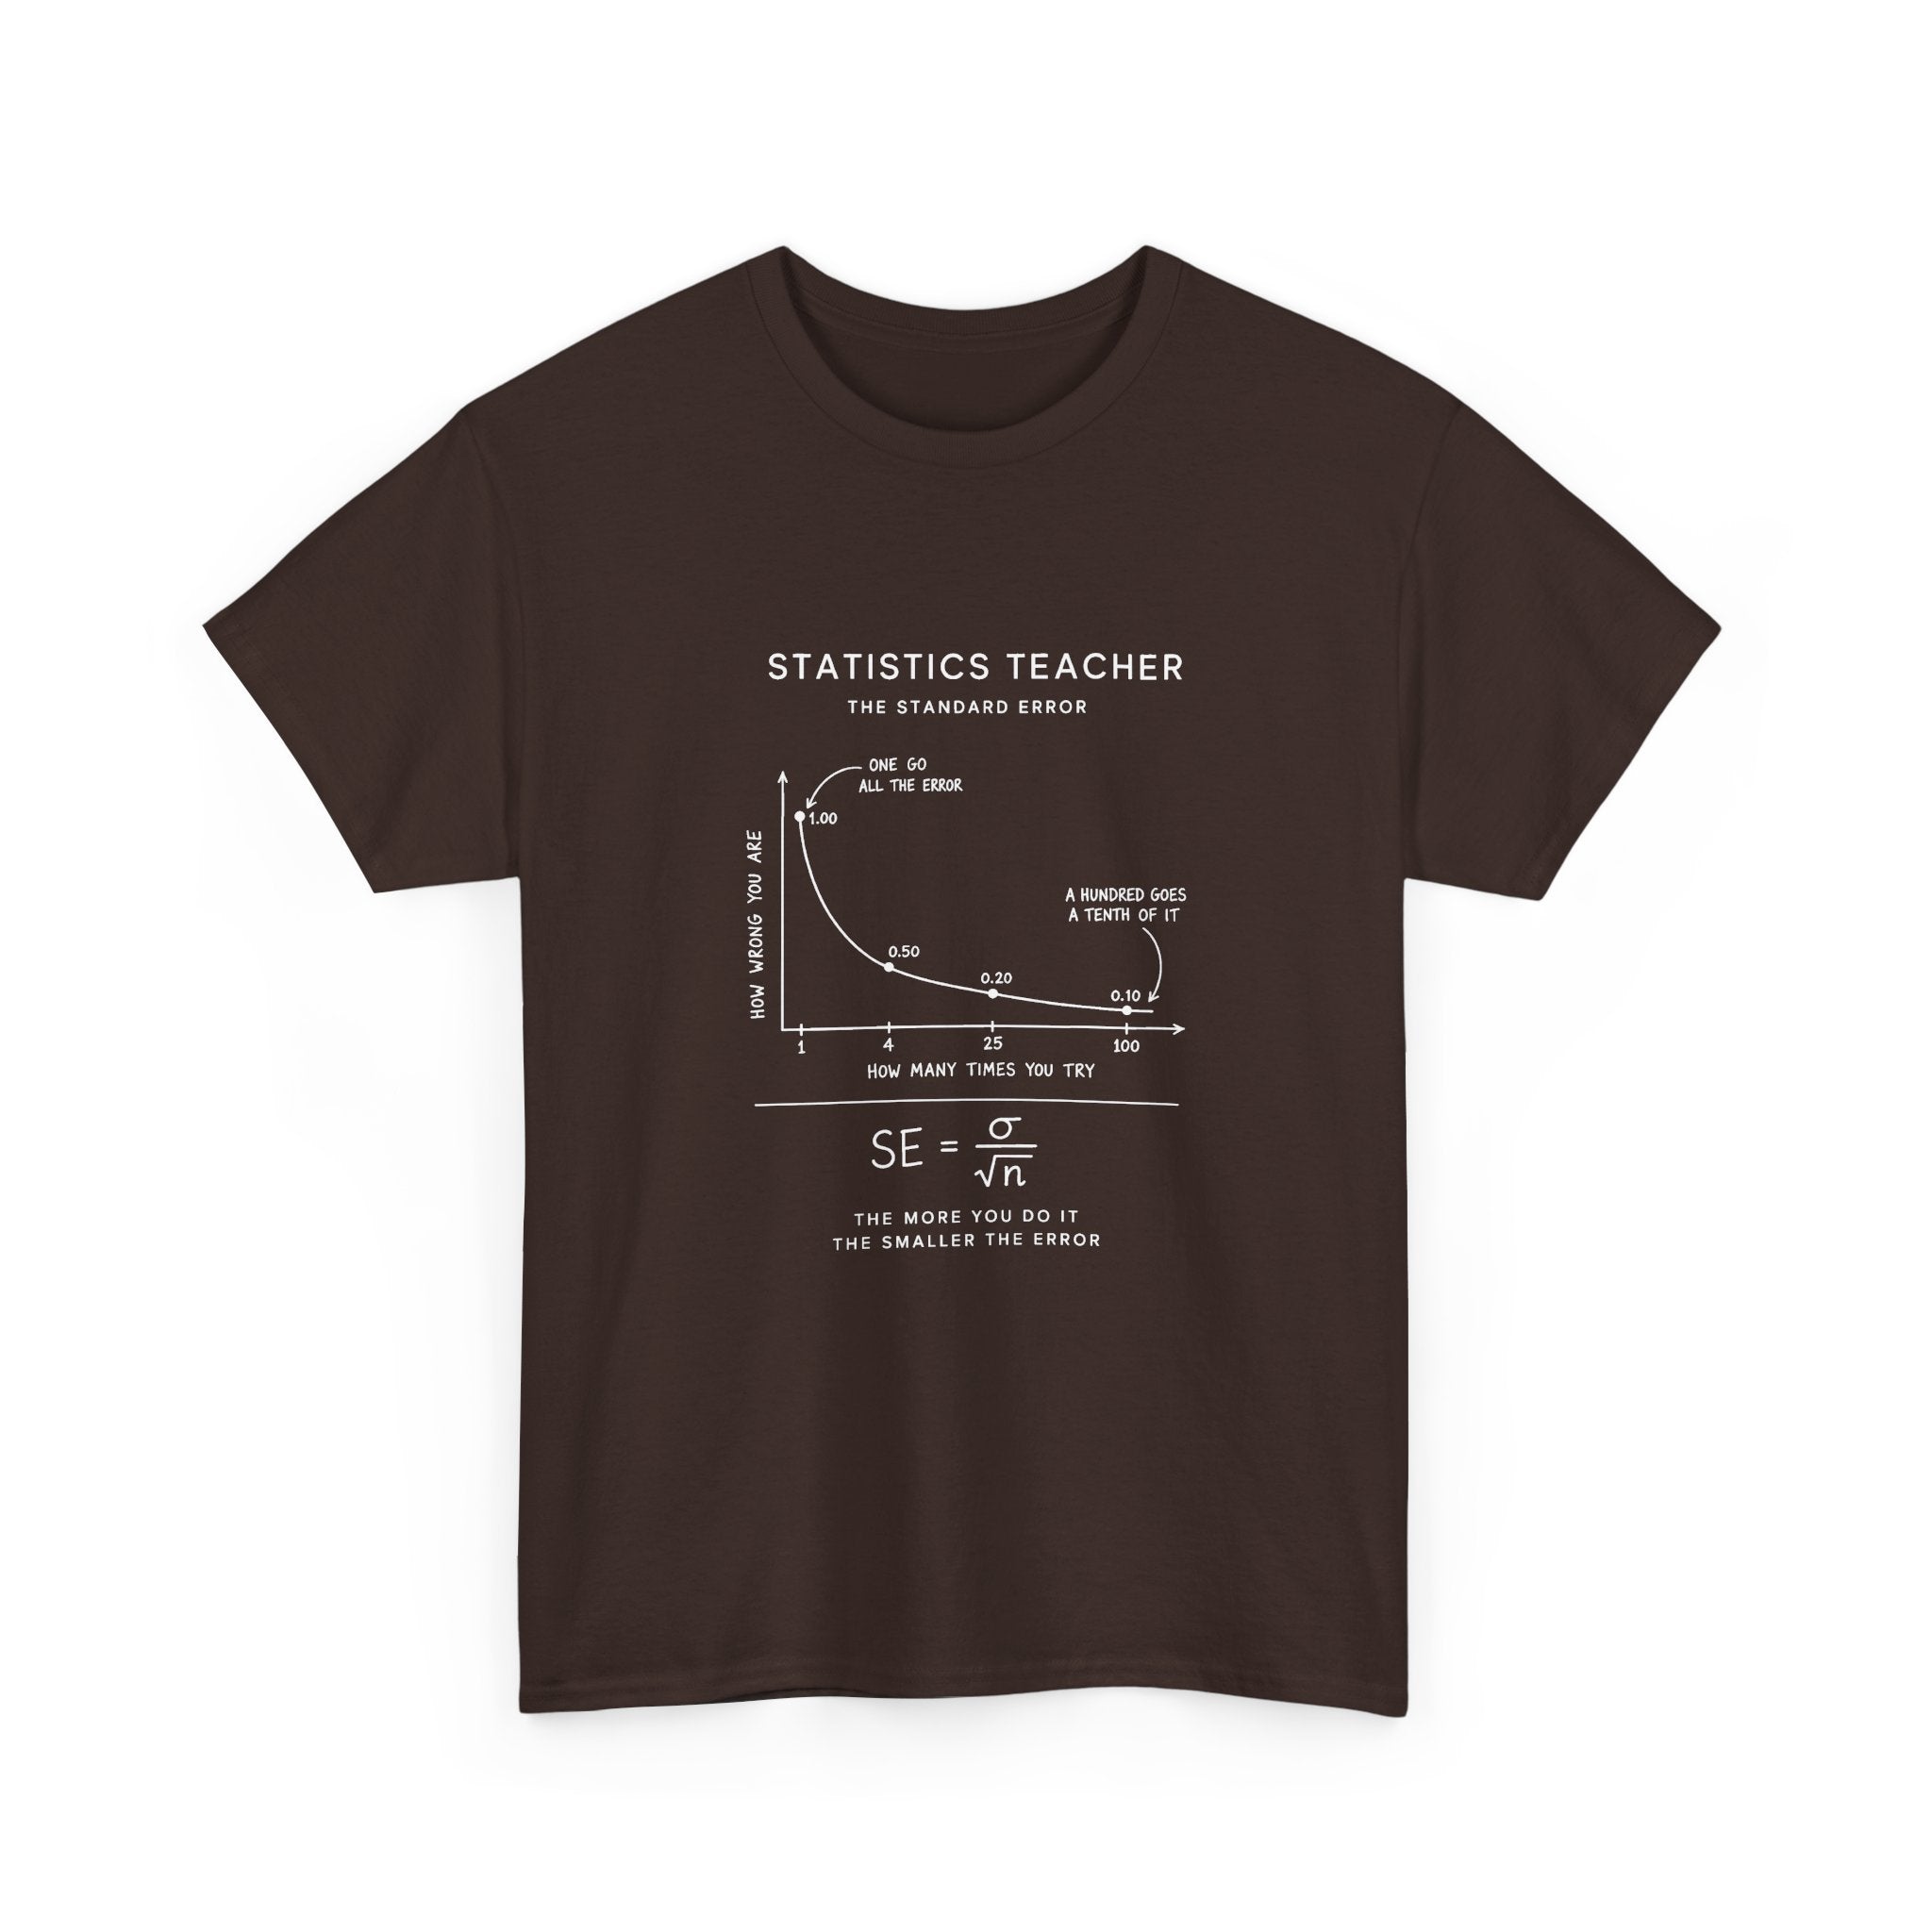
Statistics Teacher: The Standard Error
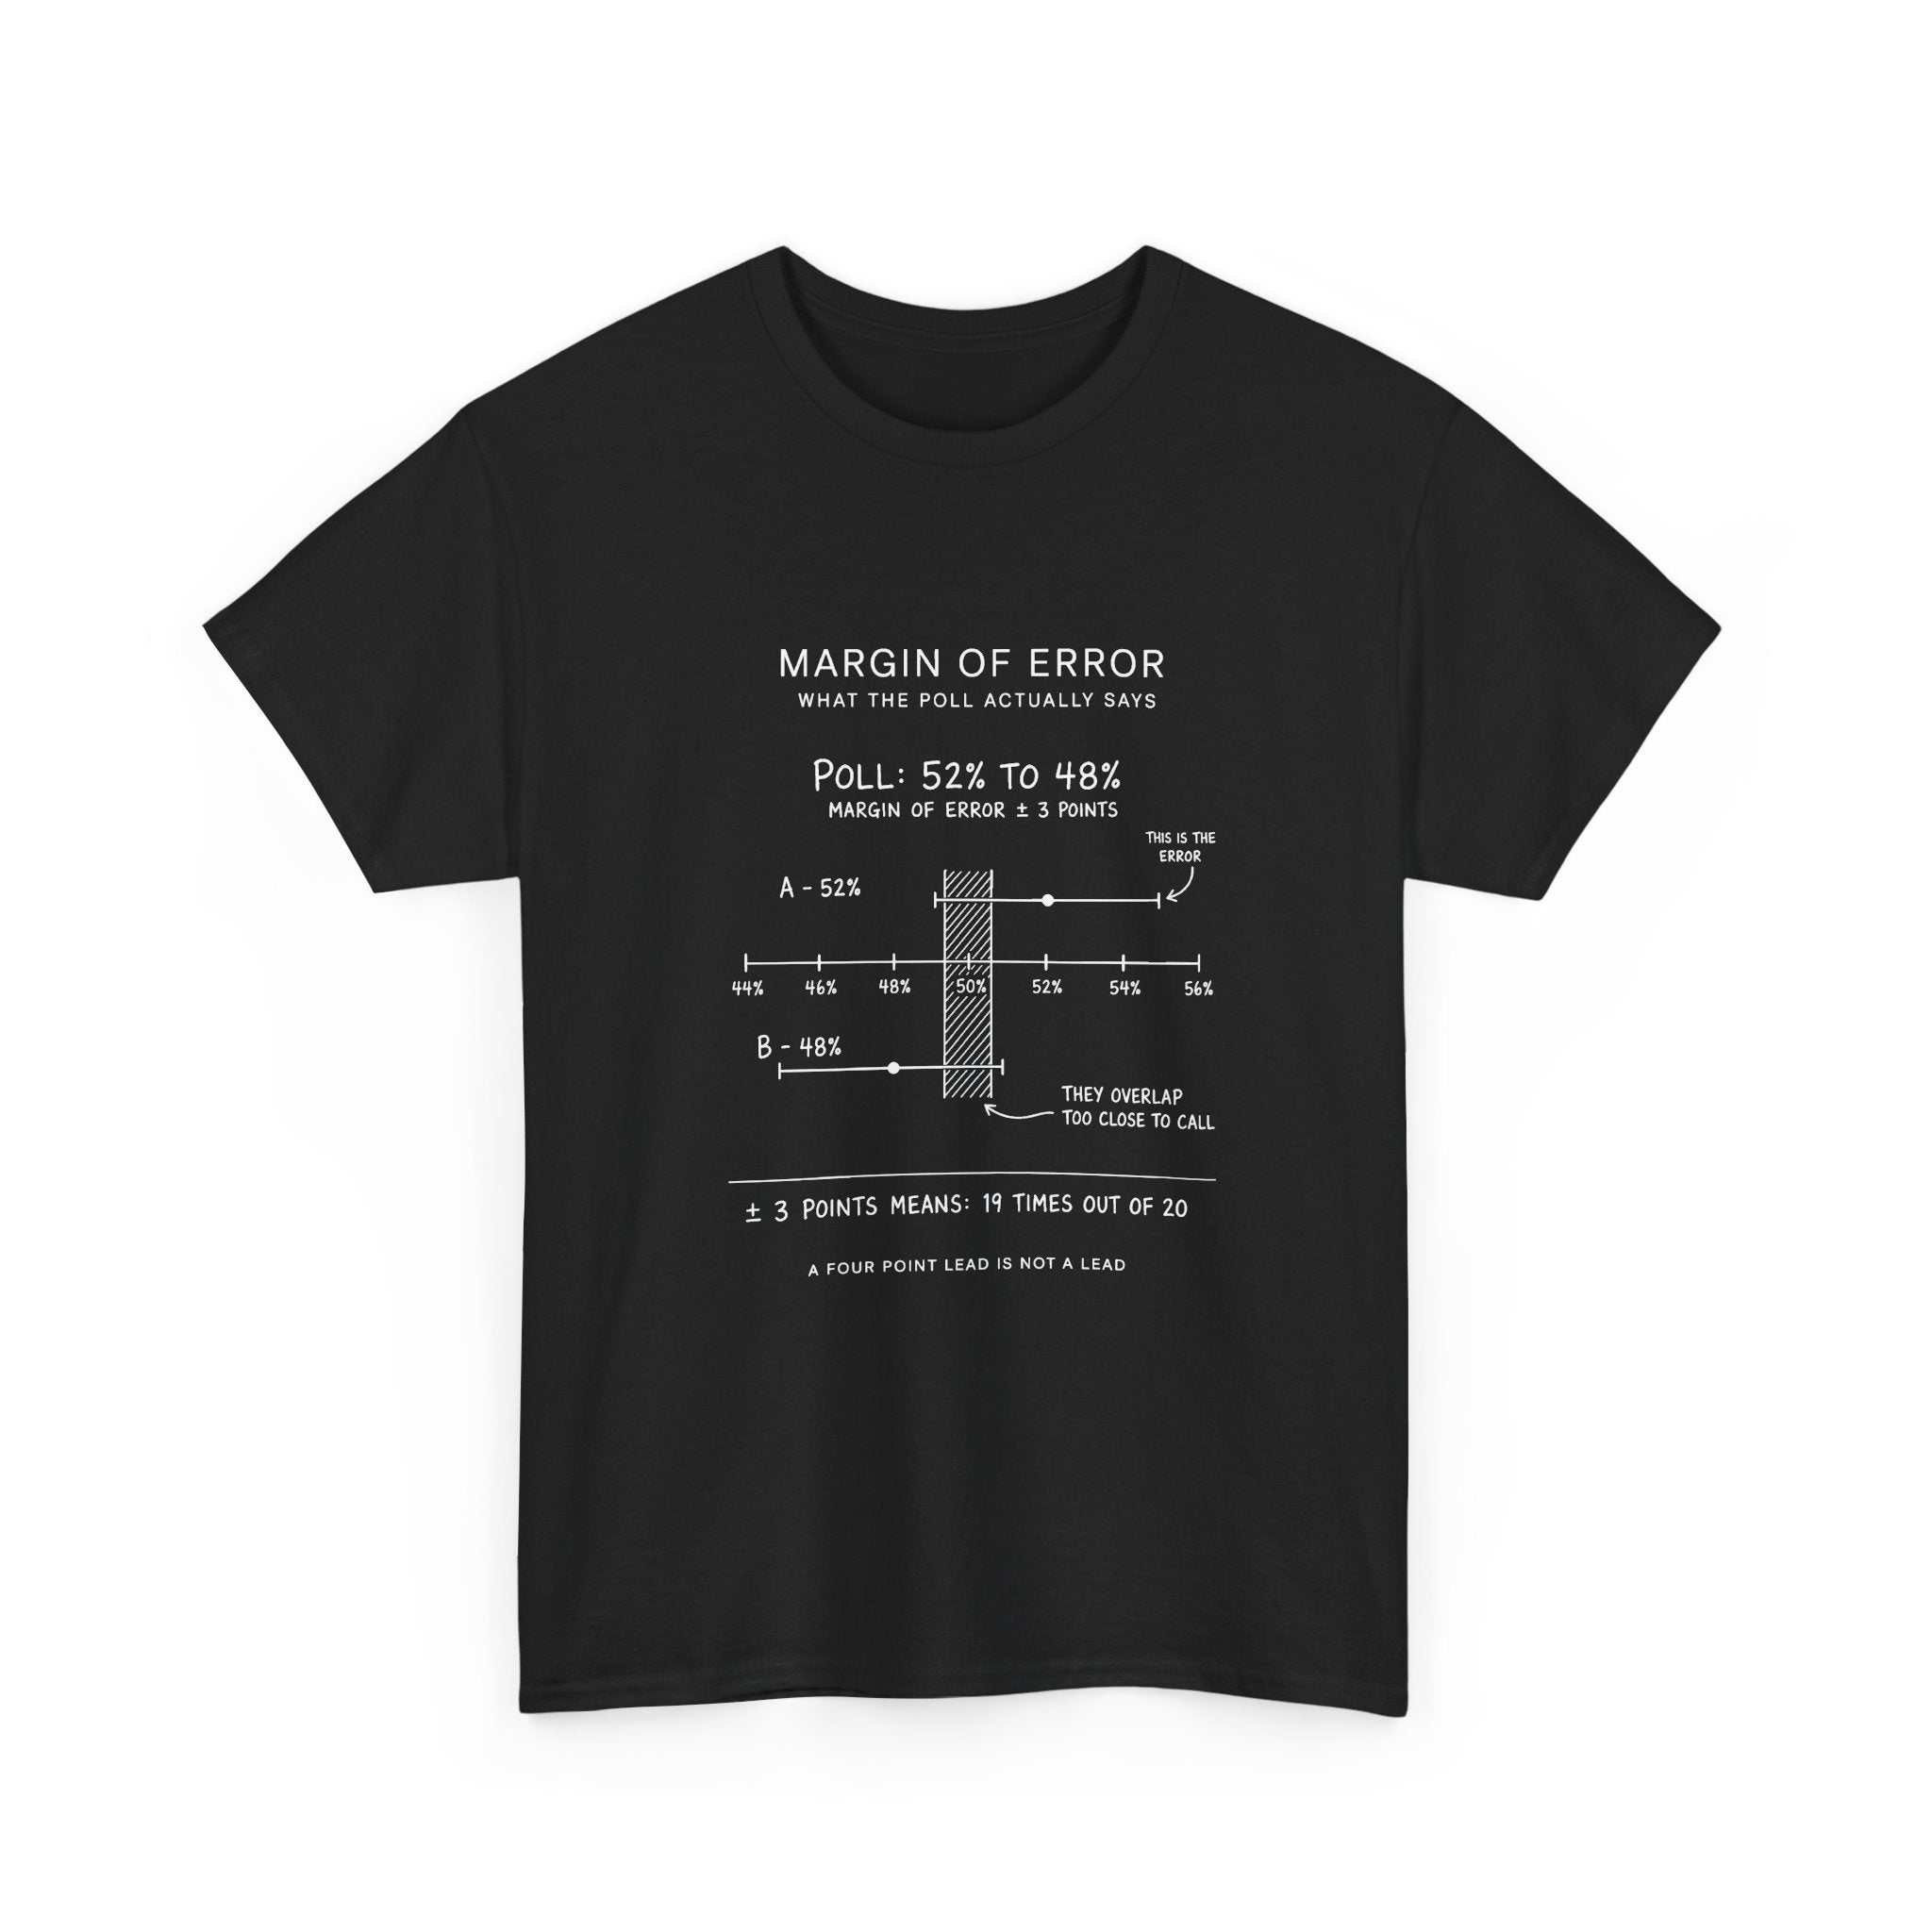
Margin Of Error
Margin Of Error Sale price$25.00
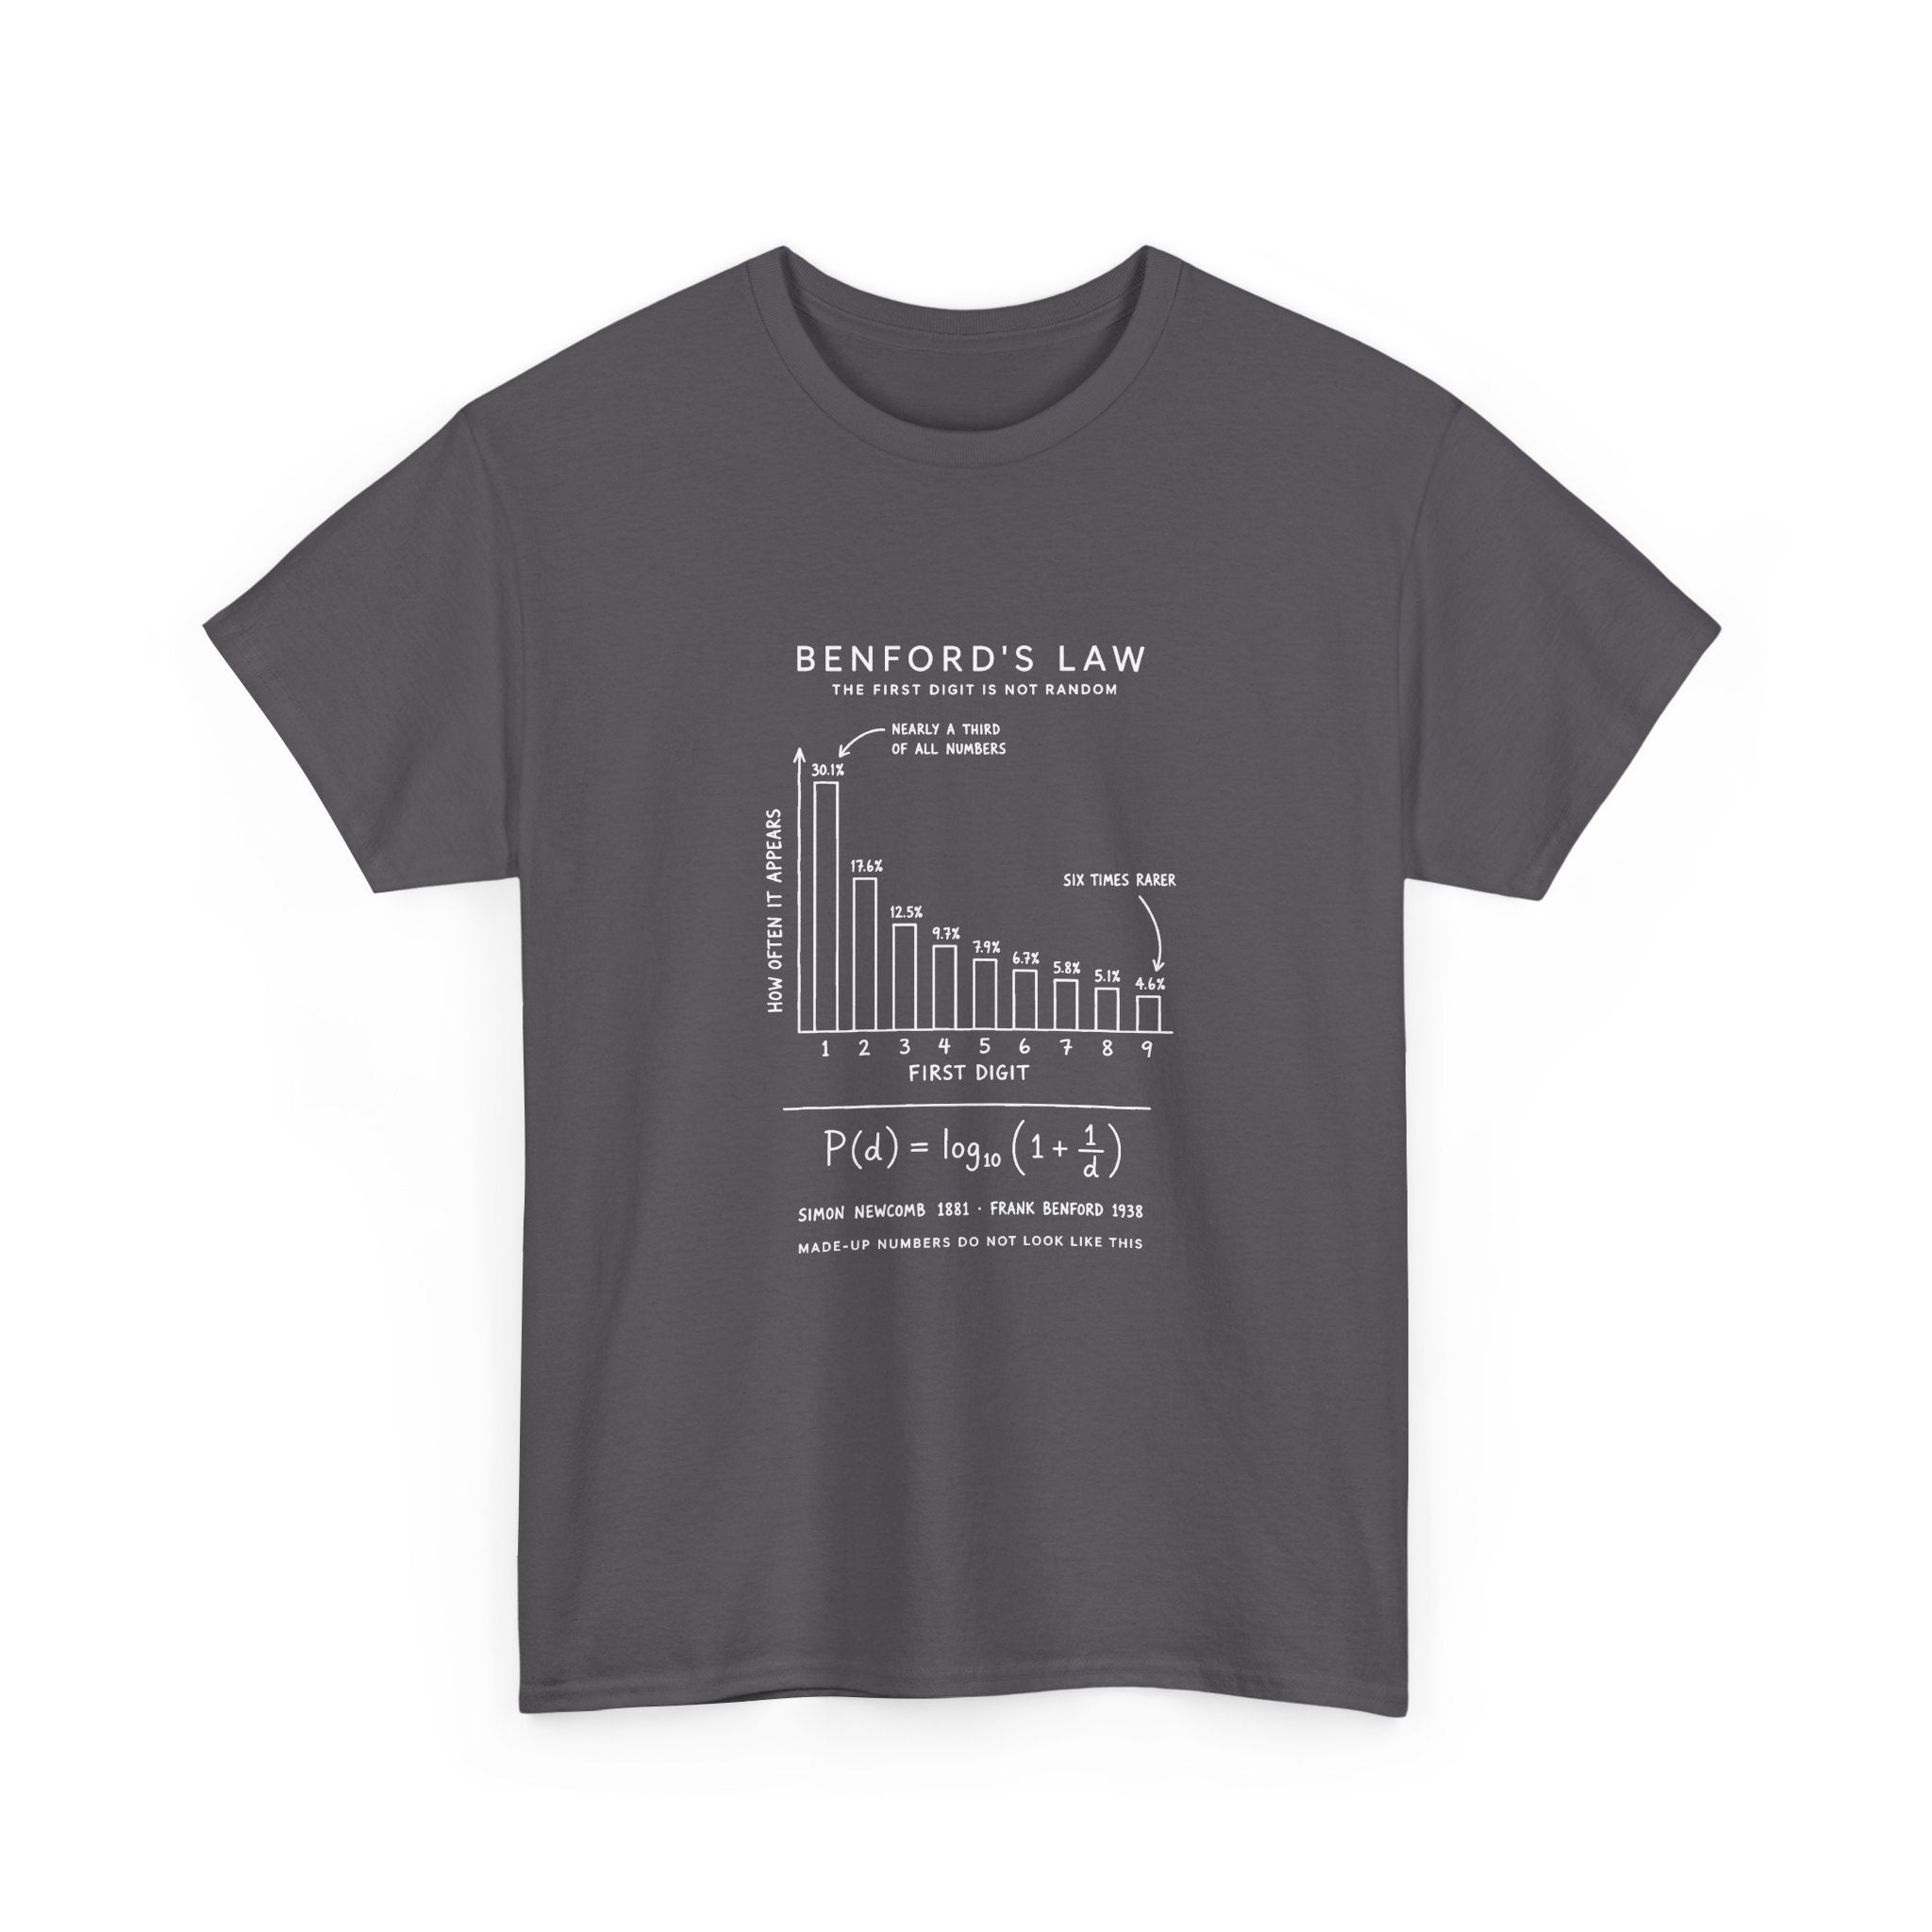
Benford's Law
Benford's Law Sale price$25.00
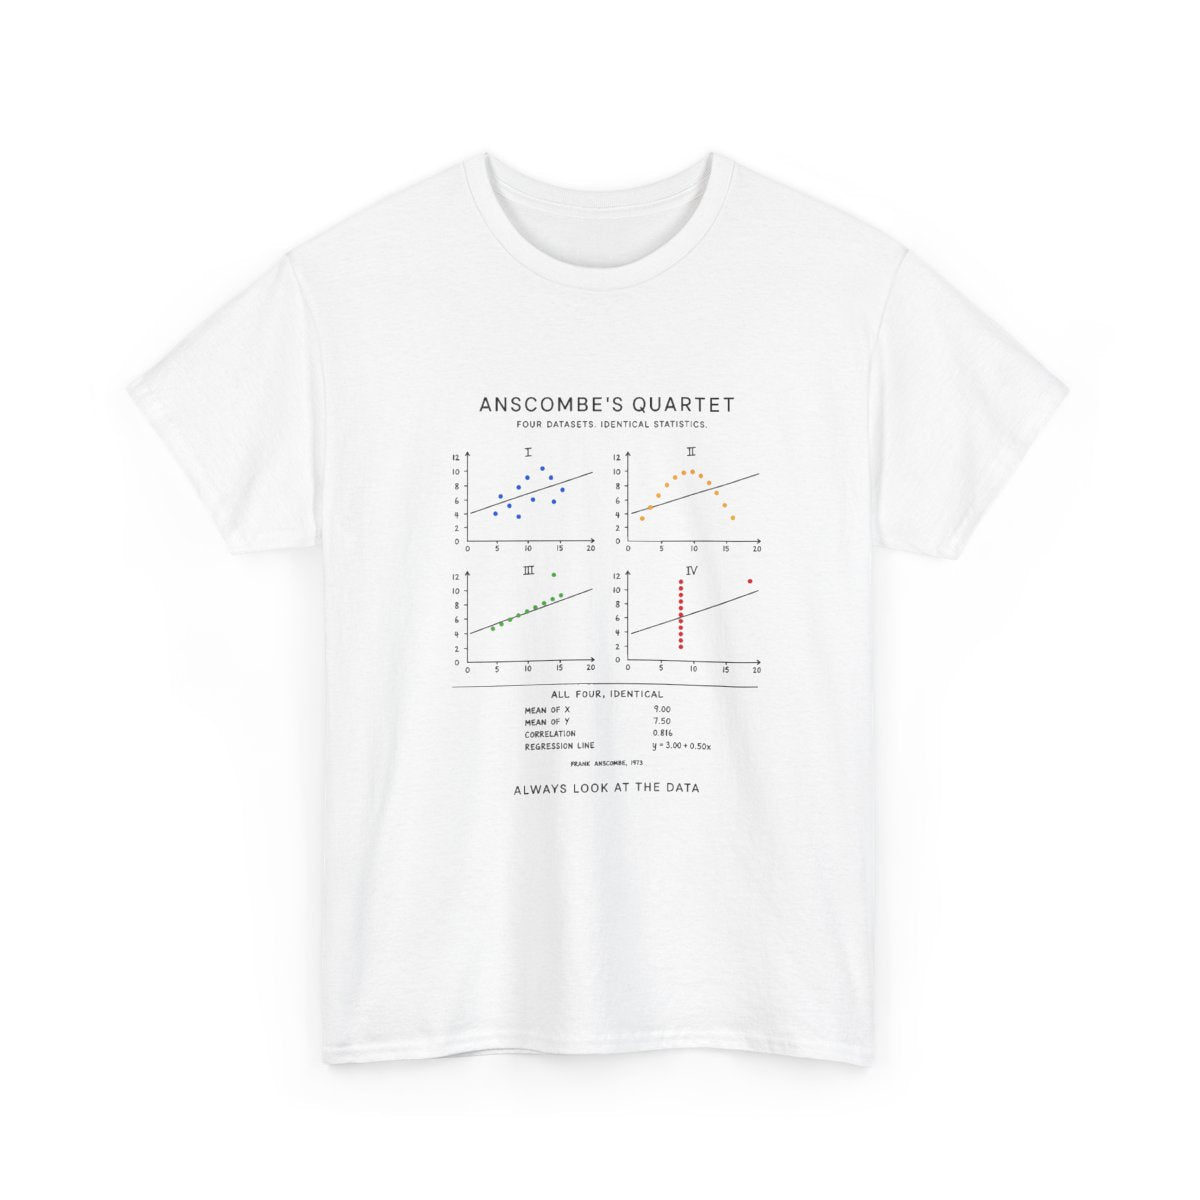
Anscombe's Quartet
Anscombe's Quartet Sale price$25.00
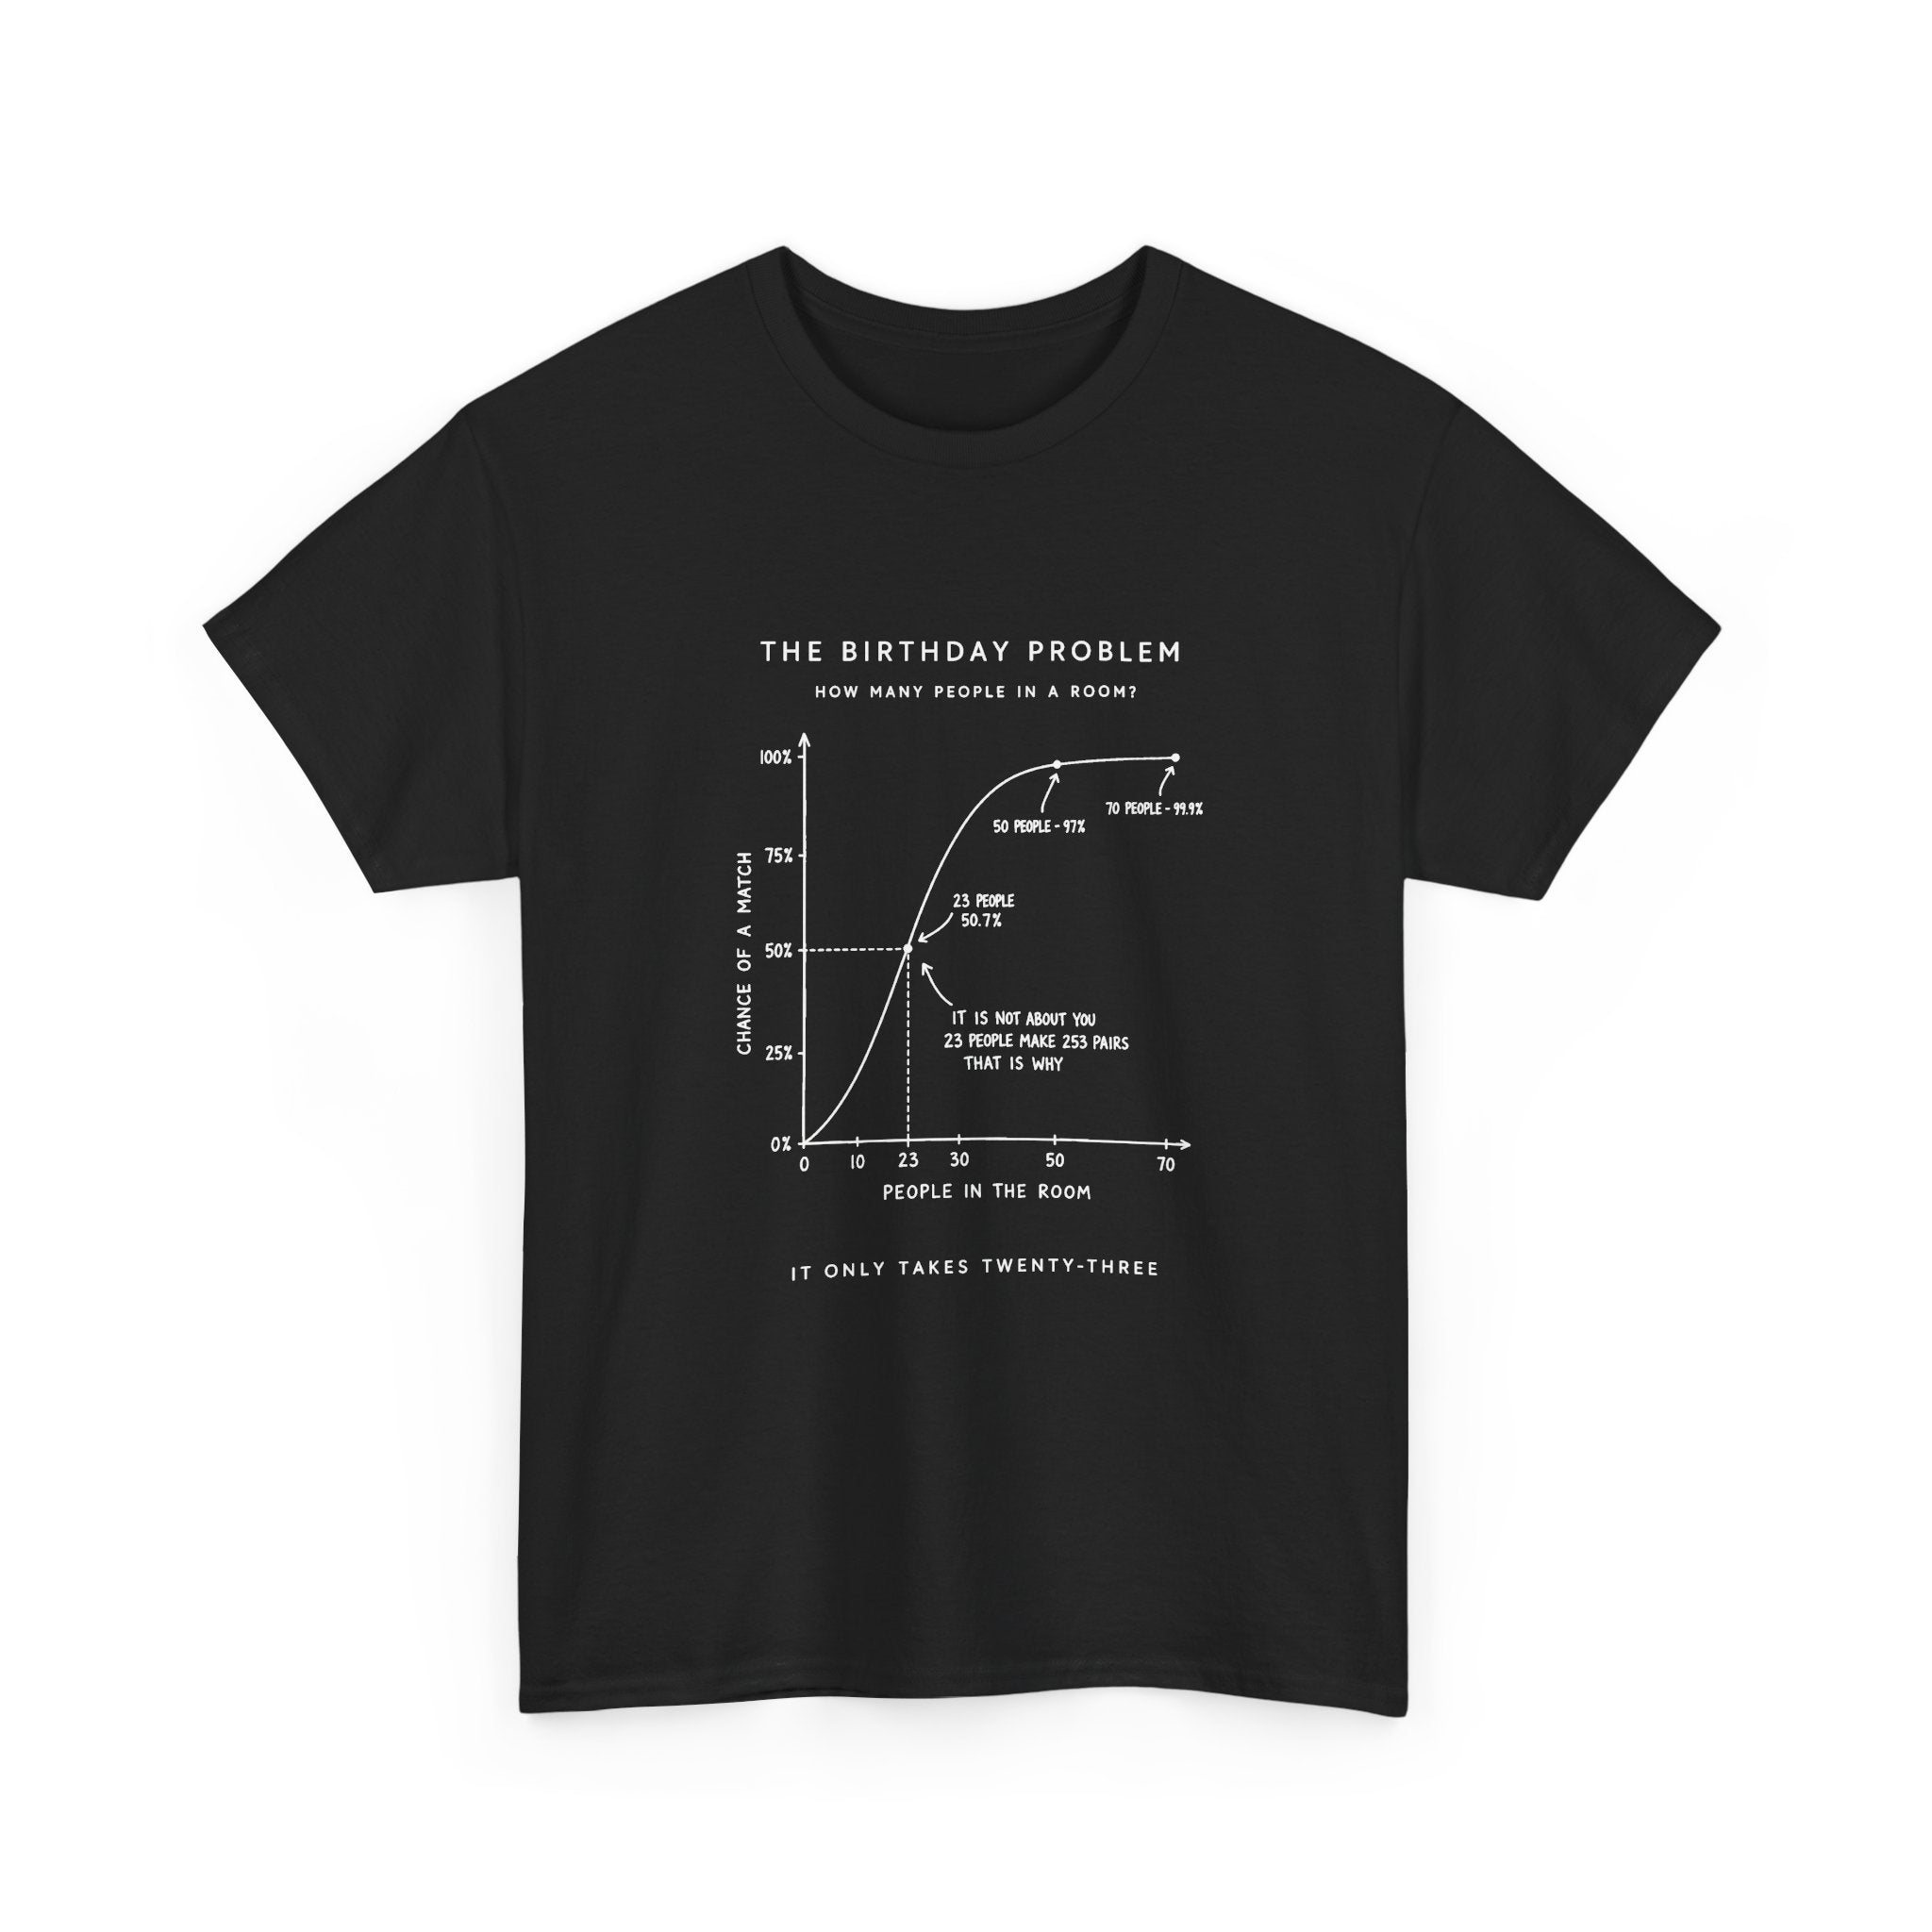
The Birthday Problem
The Birthday Problem Sale price$25.00
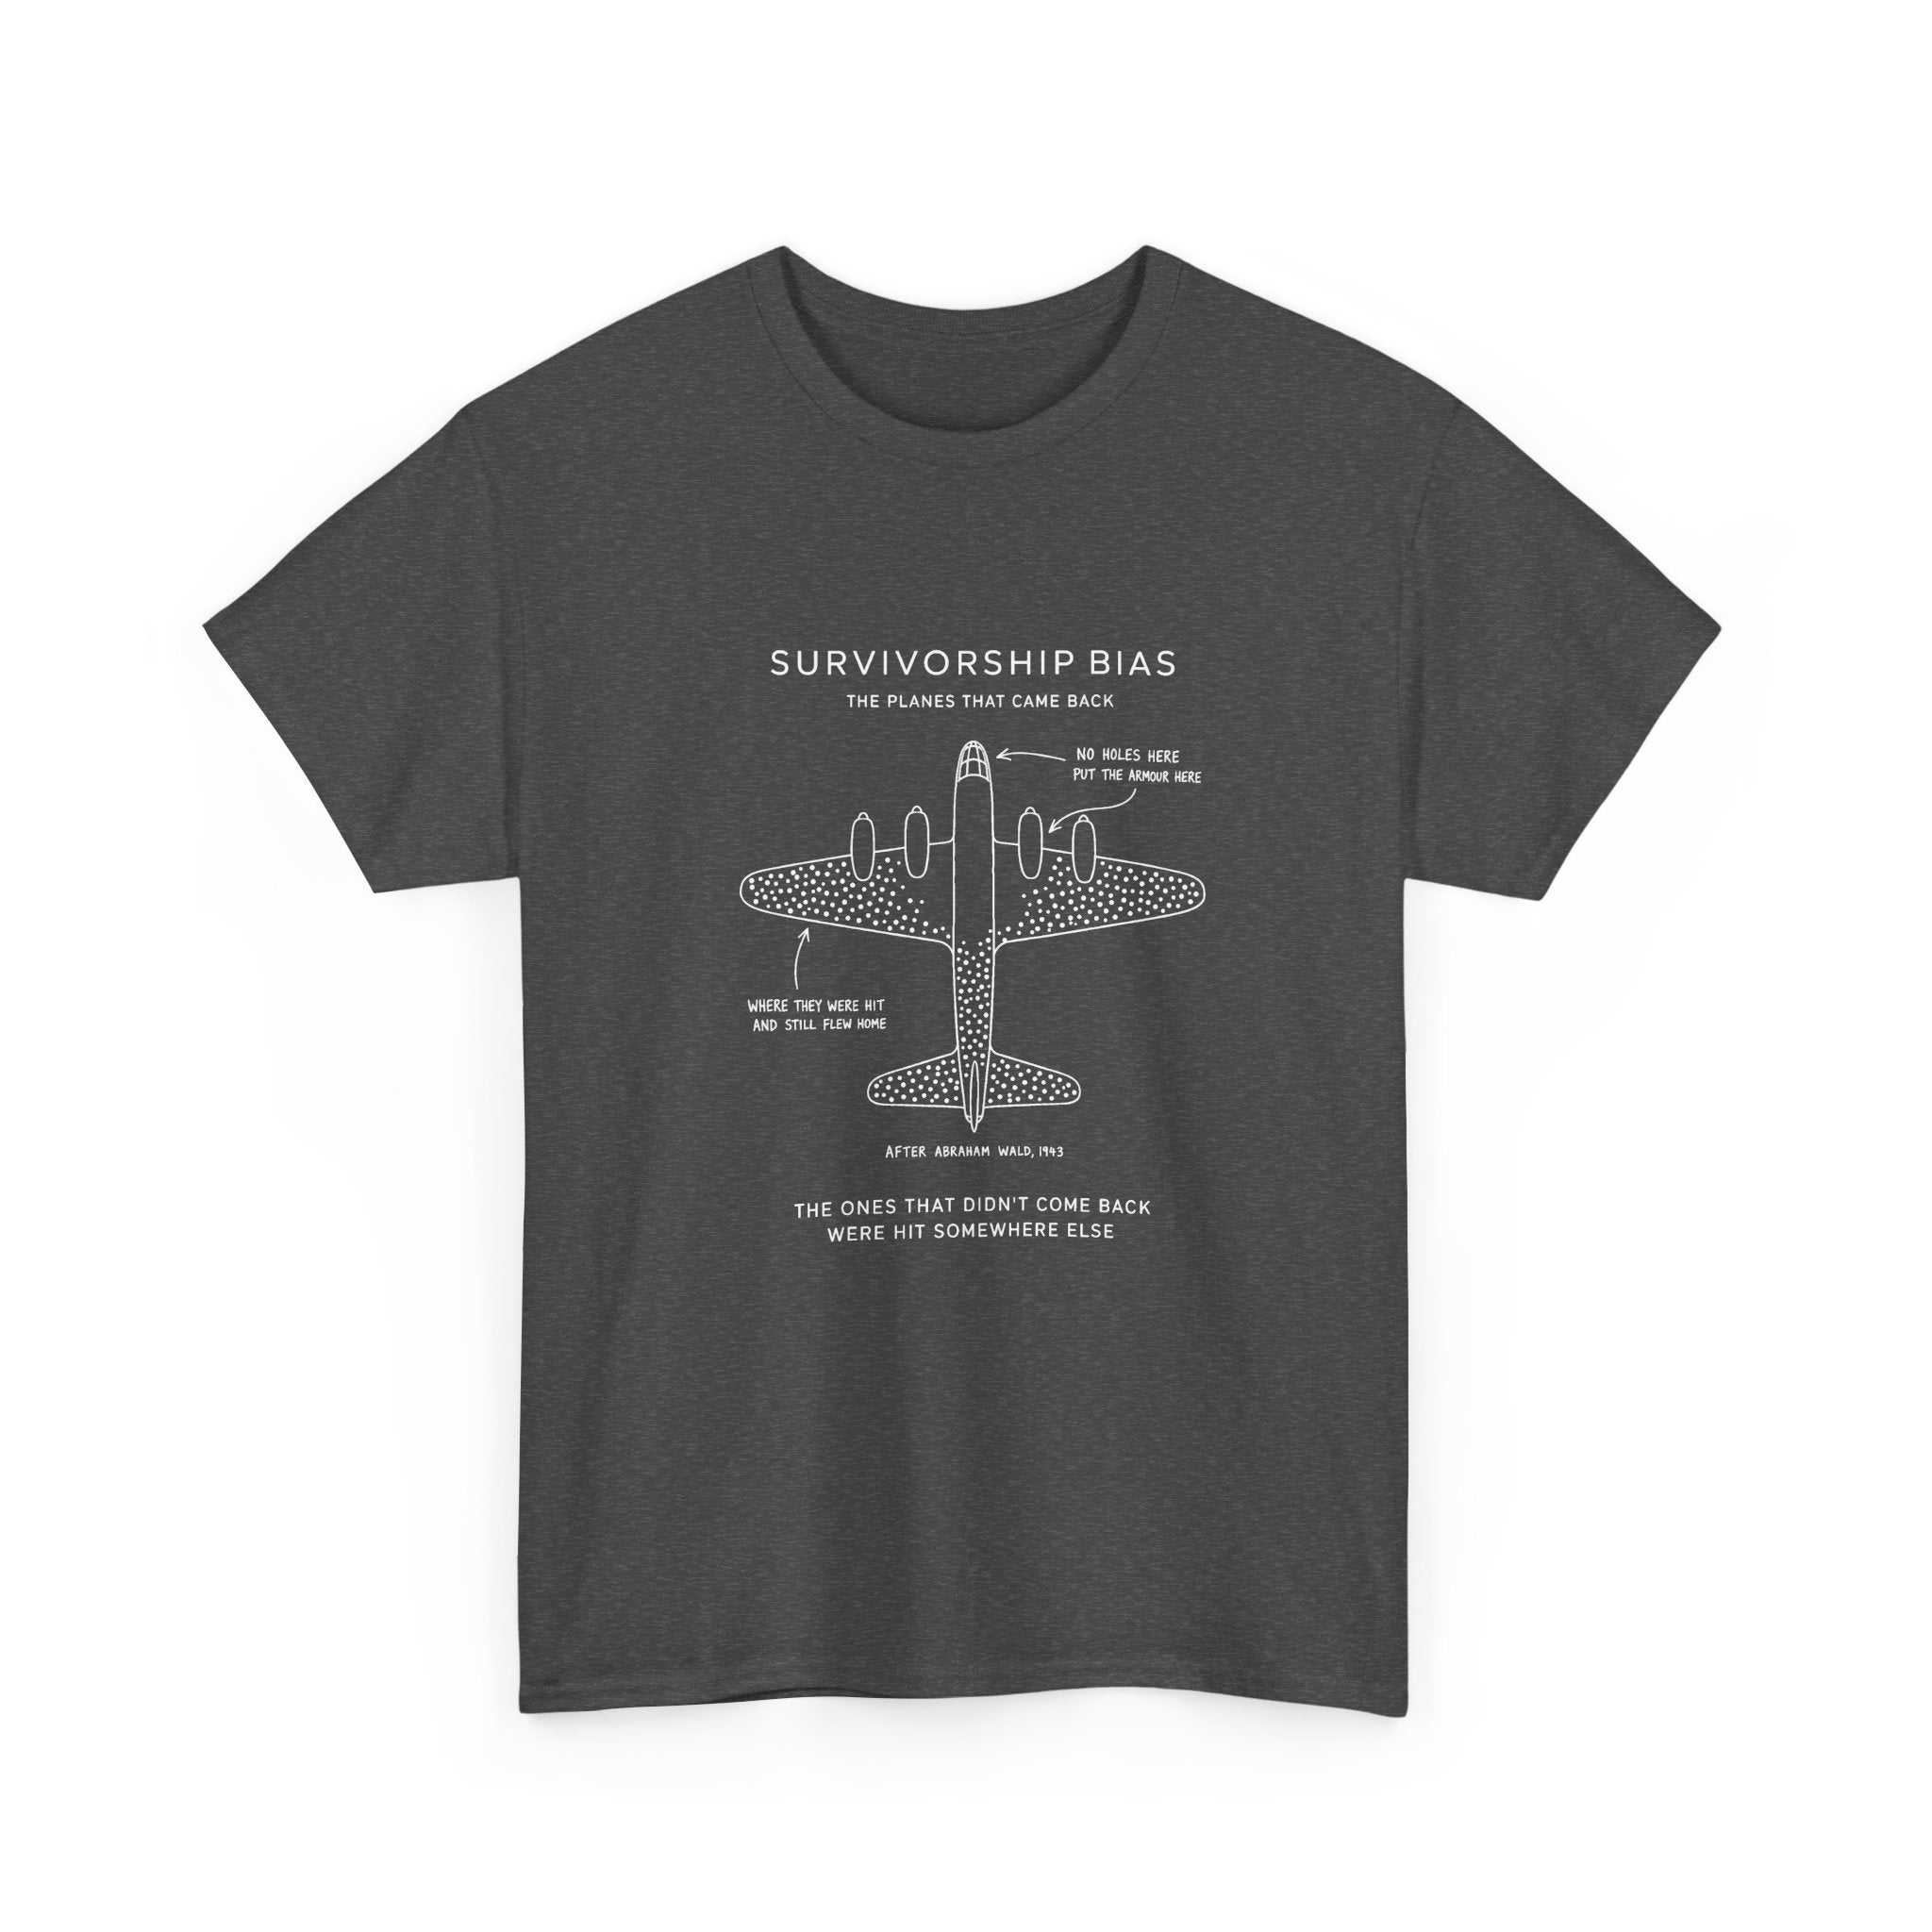
Survivorship Bias
Survivorship Bias Sale price$25.00
Simpson's Paradox
Simpson's Paradox Sale price$25.00
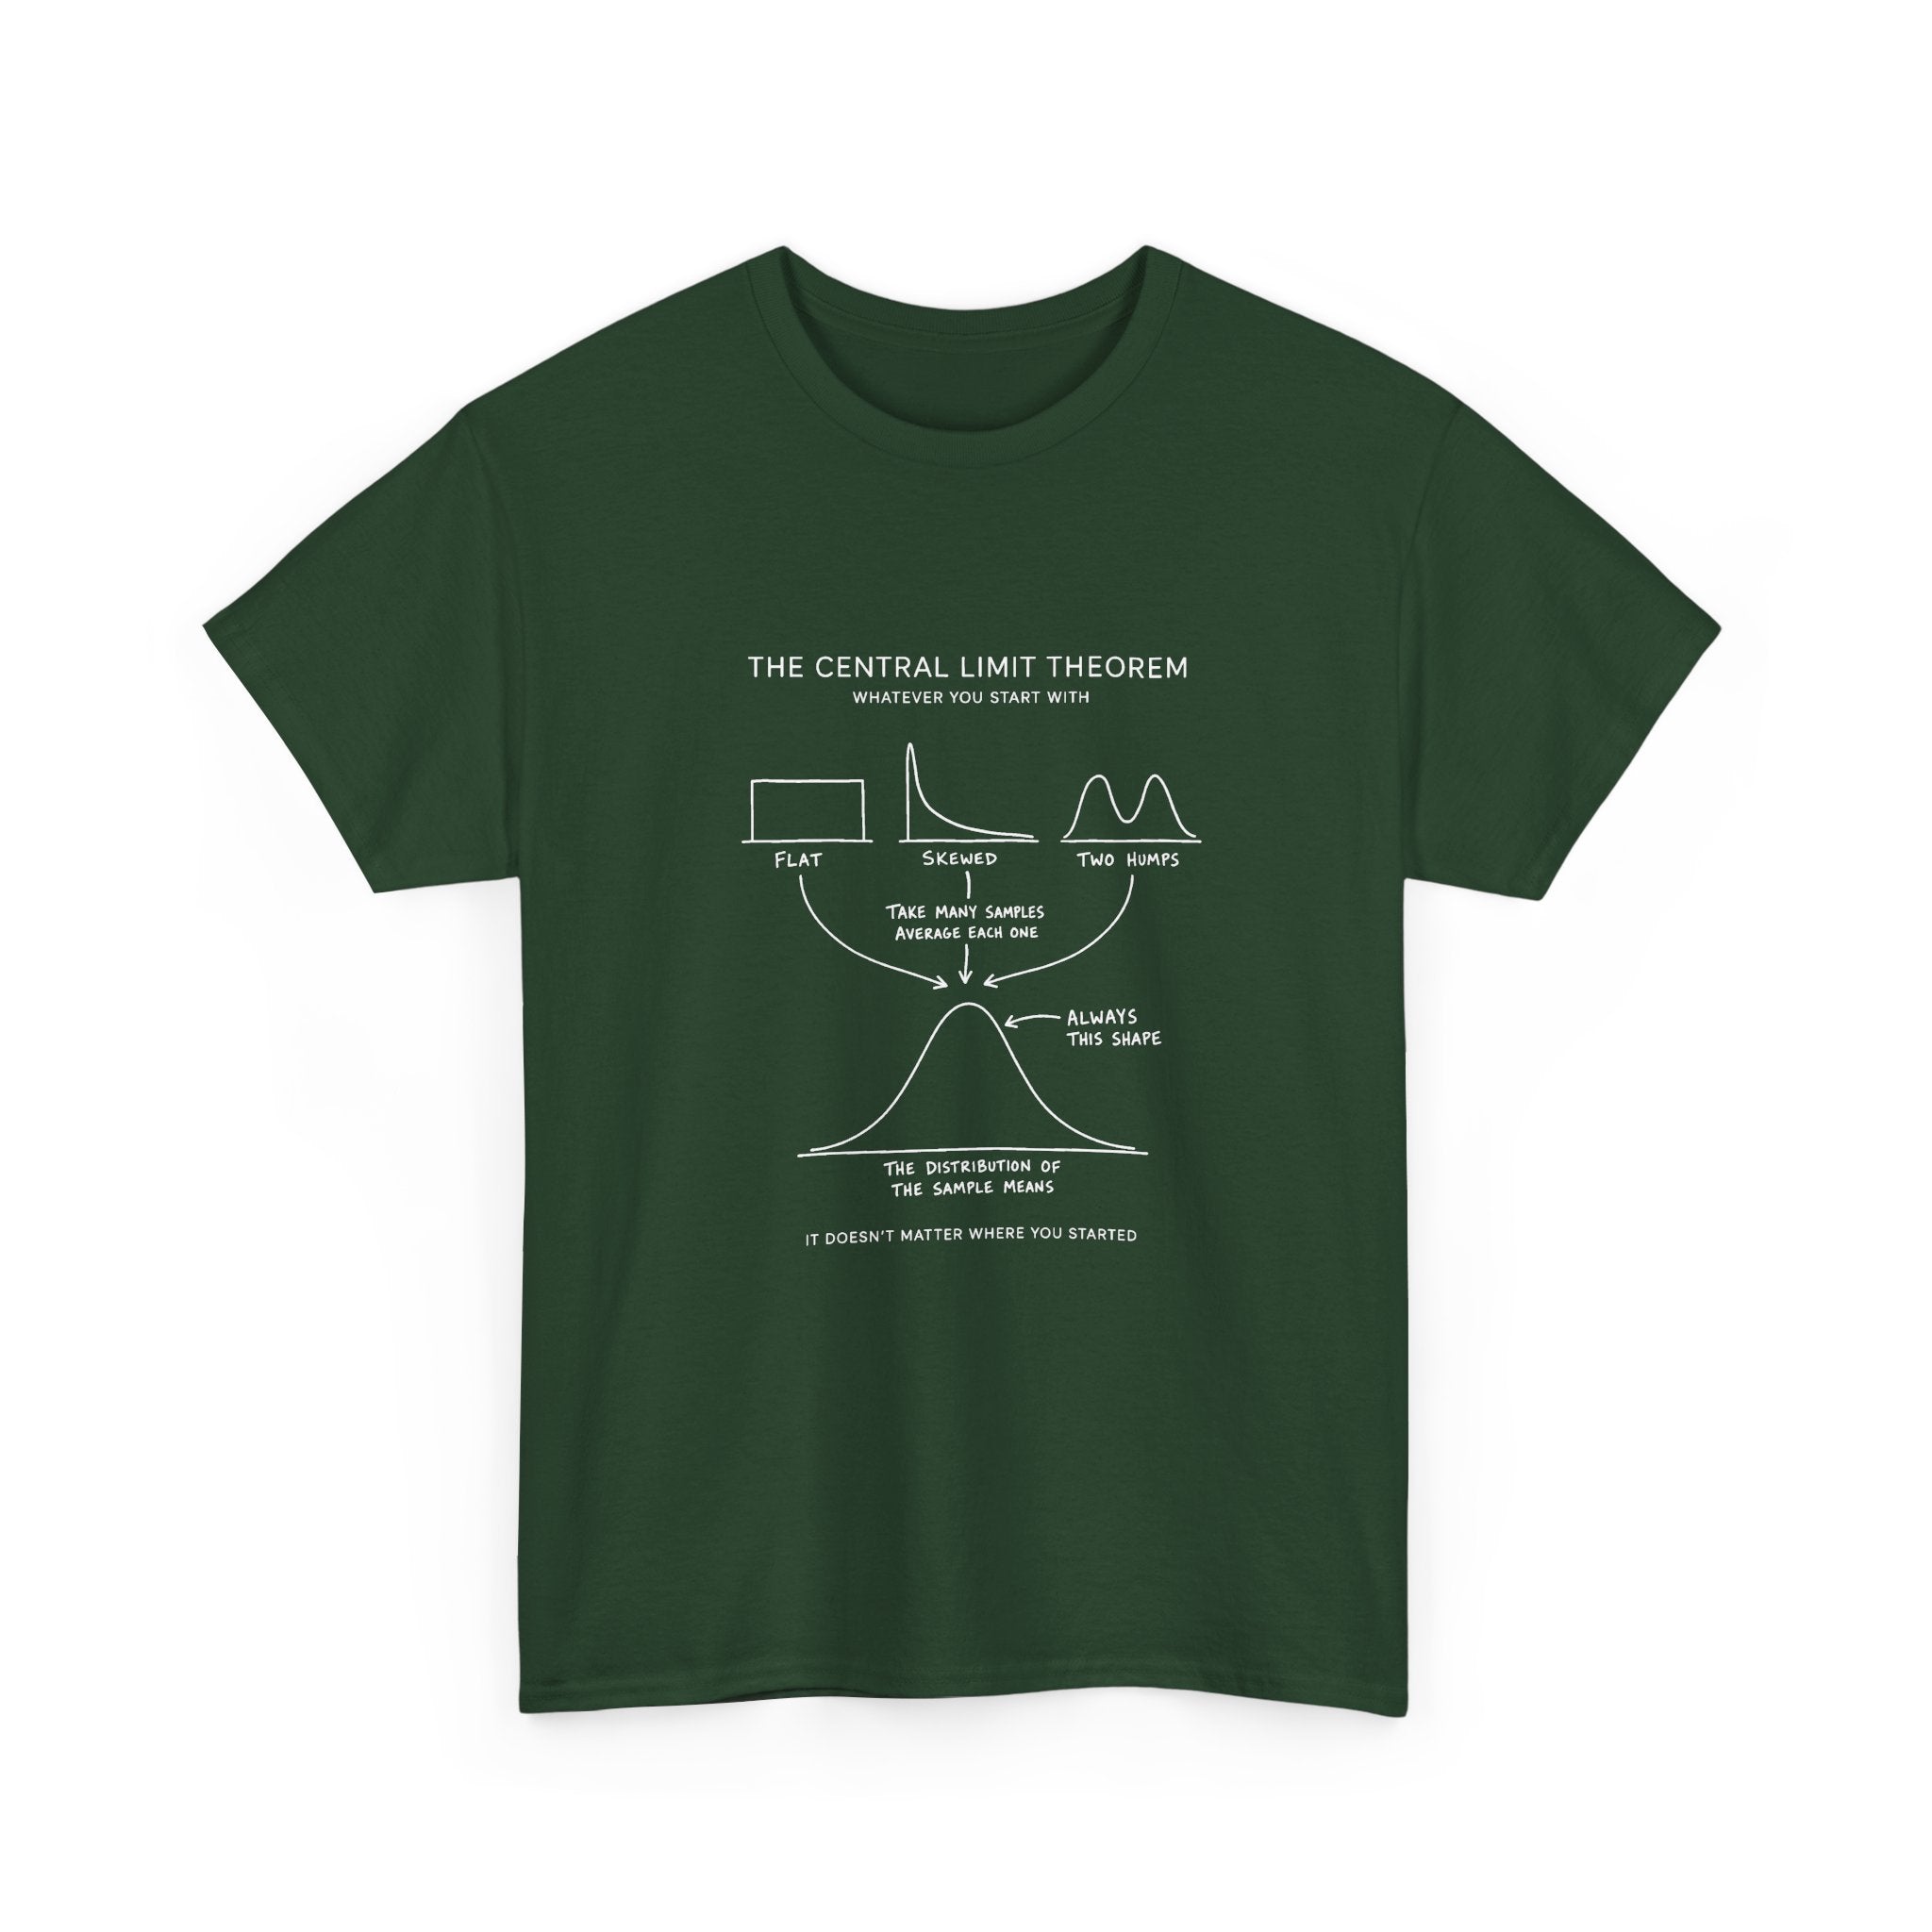
The Central Limit Theorem
The Central Limit Theorem Sale price$25.00
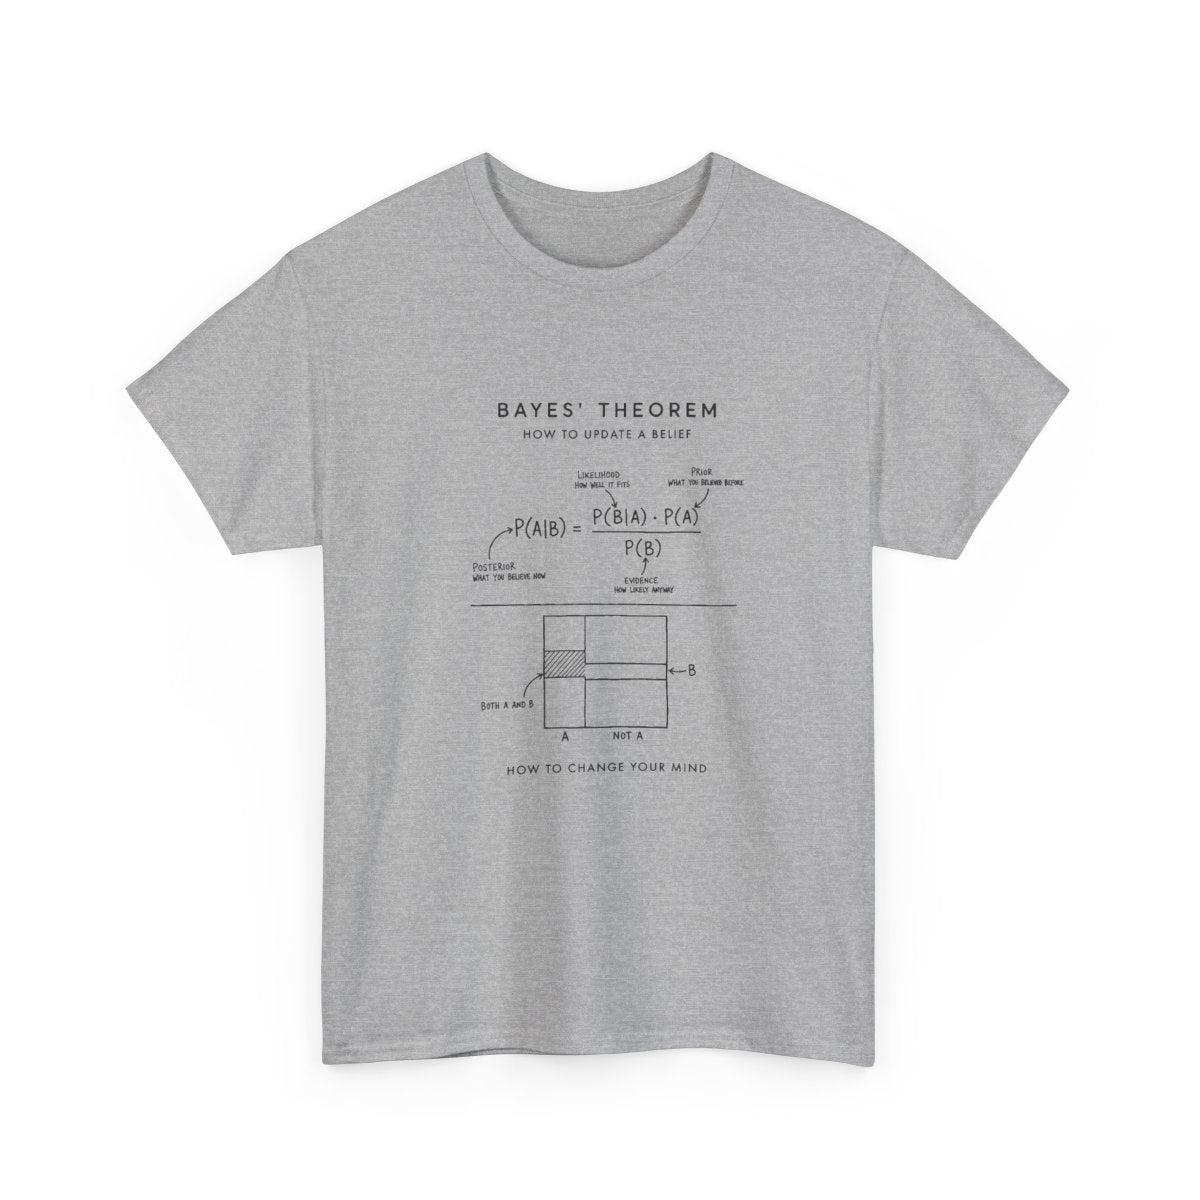
Bayes' Theorem
Bayes' Theorem Sale price$25.00
The Normal Distribution
The Normal Distribution Sale price$25.00
Modeasaur
Modeasaur Sale price$25.00
Medianodon
Medianodon Sale price$25.00

Outliers Welcome

Distributions · Probability · Bias

Where the curve, the sample and the conclusion nobody was entitled to draw become small pieces of editorial design. A look at how the discipline that decides what a number actually means ended up on a math shirt, and why the jokes land hardest with the people who read the small print.

The Statistics Tee, As Sample

Statistics is the branch that refuses to let anyone off lightly. Every claim gets a range attached to it, every result gets asked how many people it came from, and the honest answer is usually less certain than the headline. It is the least romantic mathematics there is, which is exactly why the shirts are the funniest.

The shirts that wear well rarely explain themselves. They reward the second look: the fraction that cannot possibly be right, the ghost hiding inside a distribution. That is the rule the statistics range keeps coming back to.

Forget Average Be An Outlier statistics t-shirt Shop Be An Outlier →
The Normal Distribution statistics t-shirt
Editor's Pick

The Normal Distribution

One curve that turns up everywhere, in heights and errors and exam marks and things that have nothing to do with each other, simply because that is what happens when enough small independent effects add up. It is the most recognisable shape in mathematics after the circle, and it carries its whole meaning in its outline. Worn by the people who work with data all day, by teachers who have drawn it a thousand times, and by anyone who likes an idea that quietly explains half the world. It reads clean from right across the room.

See The Normal Distribution →

Why Statistics Looks Better on Cotton

There is something about a chart on a soft surface that changes how you read it. In a report it is a slide someone is using to win an argument. The same figure, set in clean white line work on a black tee, becomes something else: a private signal between the people who did the reading, who know that two lines moving together prove nothing at all on their own.

That is the small magic the statistics tee has always had. It is not a dashboard. It is an argument you can wear. And the people who clock it are usually the ones worth standing next to at the party.

Correlation Is Not Causation statistics t-shirt Shop Correlation →